Node Graph
Explore JSON structures as interactive force-directed node graphs with expand/collapse, search, zoom, and export features.
Last updated:
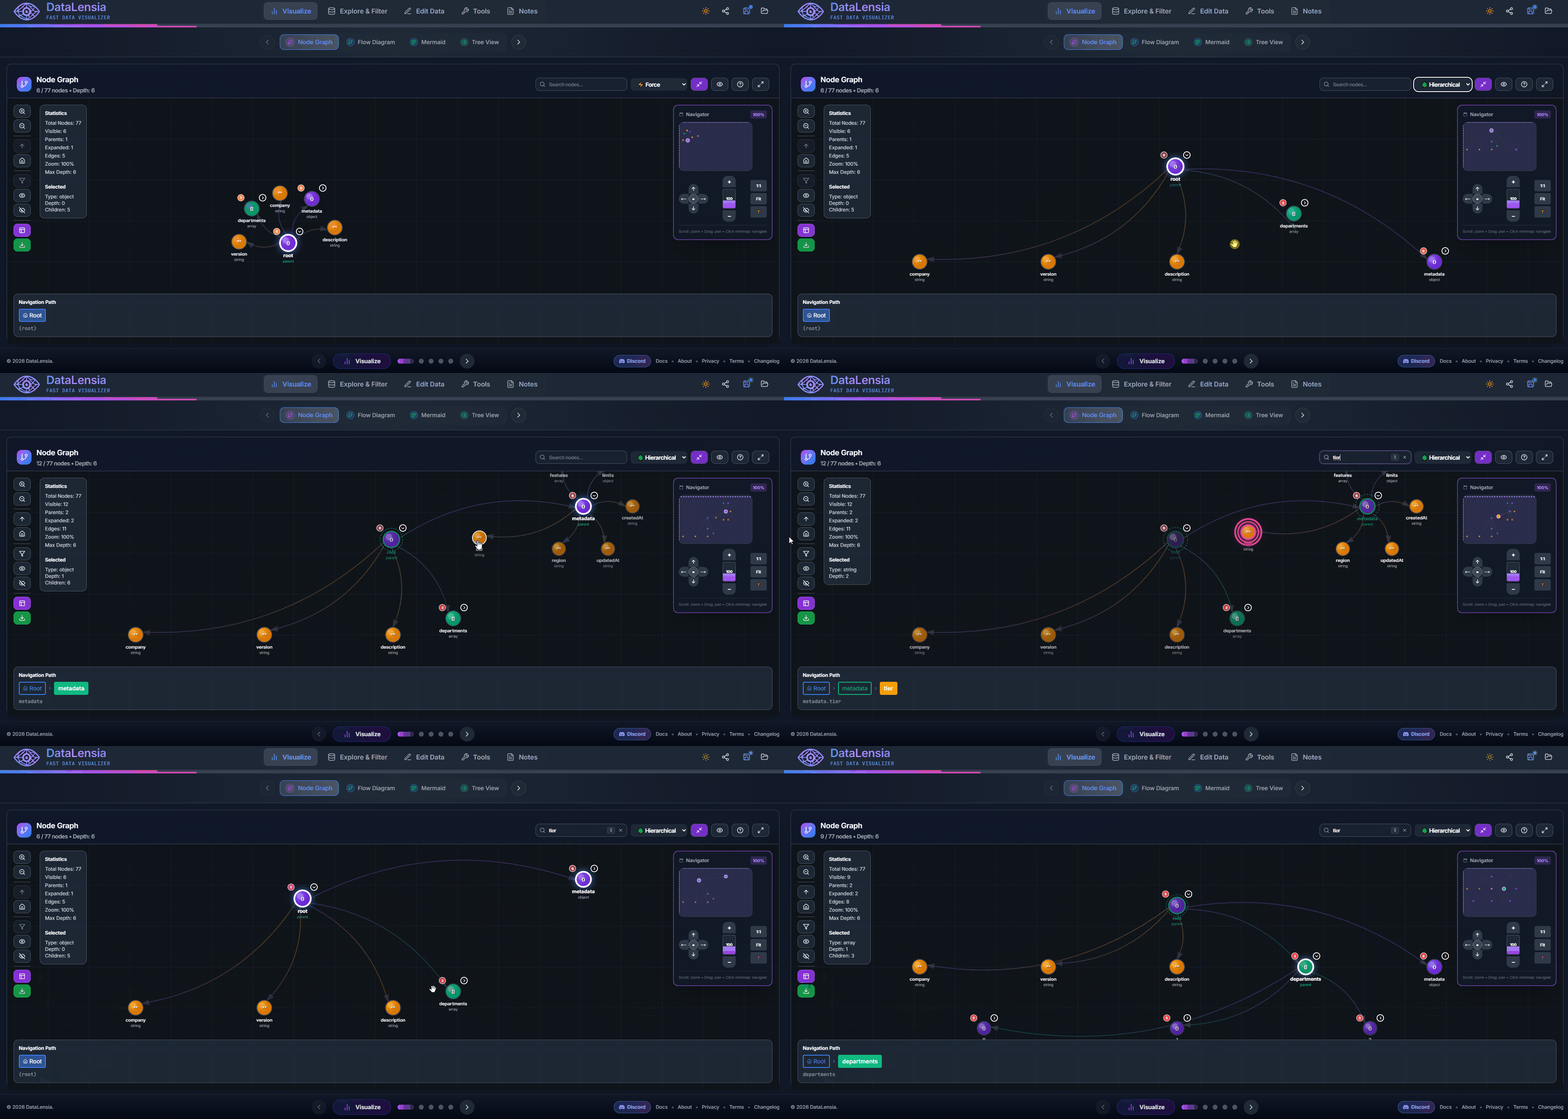
The Node Graph is a Canvas-based force-directed visualization that renders your JSON data as an interconnected graph of nodes. It is ideal for understanding relationships and hierarchies in complex data.
🔍 Key Features
- Force-directed layout: Nodes self-organize to minimize edge crossings and overlap.
- Expand/Collapse: Click any node to expand its children or collapse a branch — keeps large datasets manageable.
- Search: Find specific keys or values and highlight the matching node in the graph.
- Zoom & Pan: Smooth scroll-to-zoom and drag-to-pan navigation.
- Fullscreen Mode: Fill the entire viewport for maximum canvas space.
- Export: Download the current graph view as a PNG image.
🎨 Visual Design
Nodes are color-coded by data type for instant recognition:
| Color | Type |
|---|---|
| 🟦 Blue | String |
| 🟧 Orange | Number |
| 🟪 Purple | Boolean |
| ⬜ Gray | Null |
| 🟩 Green | Object |
| 🟨 Yellow | Array |
Each node displays:
- The key name as a label.
- A count badge for objects and arrays (e.g.,
{5},[3]). - The value for primitive types.
⚙️ Controls
| Control | Action |
|---|---|
| Scroll wheel | Zoom in/out |
| Click + Drag background | Pan |
| Click a node | Expand/collapse children |
| Search bar | Highlight matching nodes |
| Home button | Reset view to center |
| Layout button | Re-apply force layout |
🛠️ How to Access
The Node Graph is available in the Visualize panel of a workspace:
- Navigate to the Editor (home page).
- Upload or paste JSON data.
- Navigate to the Visualize section.
- Select Node Graph from the visualization type selector.
💡 When to Use
| Use Case | Recommendation |
|---|---|
| Understanding nested hierarchies | ✅ Ideal |
| Exploring relationships between sibling objects | ✅ Ideal |
| Presenting data structures visually | ✅ Good |
| Very flat arrays with thousands of records | ❌ Use Data Explorer instead |
🚀 Try it now
Upload JSON data in the Editor and switch to the Visualize panel to see the Node Graph in action.