JSON Flow Diagram
Explore complex JSON as interactive, zoomable flow diagrams powered by React Flow with search, minimap, and export capabilities.
Last updated:
The JSON Flow Diagram tool uses React Flow to create an explorable, visual representation of your data. It is the ultimate tool for understanding deeply nested objects and arrays.
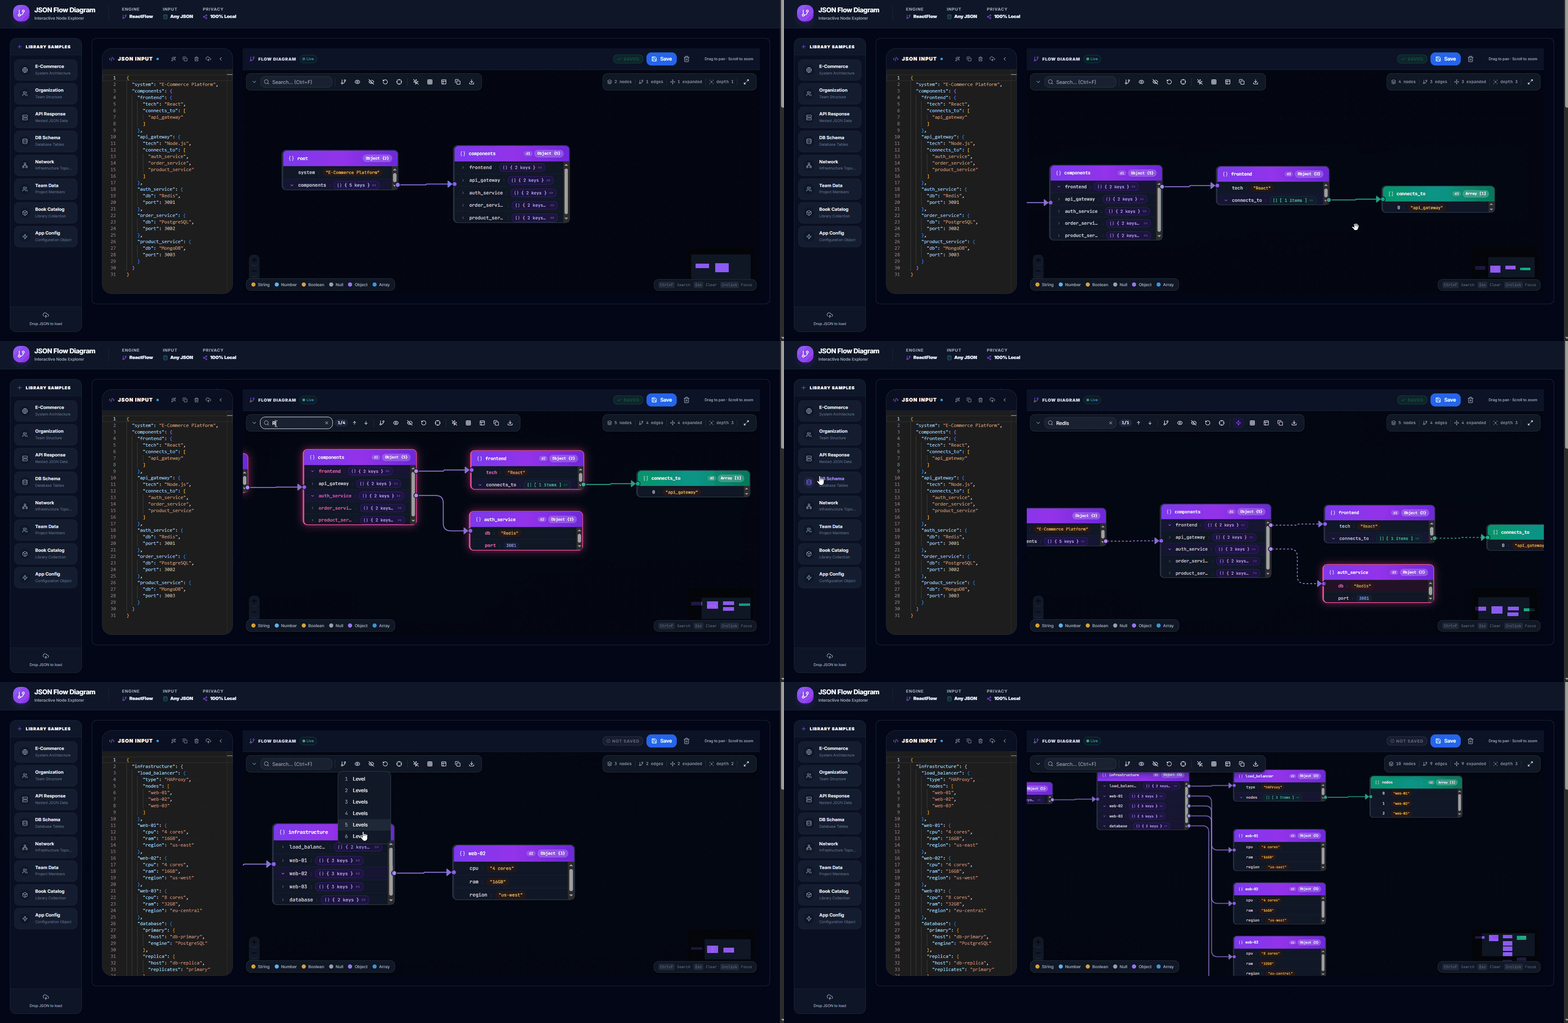
🔍 Interactive Navigation
- Stateless Sharing: Share your interactive diagram and JSON data via a compressed URL.
- Zoom & Pan: Smoothly navigate through massive JSON trees with mouse wheel and drag.
- MiniMap: A bird's-eye overview panel for quick navigation in large structures.
- Search & Highlight: Instantly locate specific keys or values across all nodes.
- Expand/Collapse: Drill into specific branches without losing context.
- Fullscreen Mode: Fill the entire screen for complex diagrams.
🎨 Visual Design
- Color-Coded Nodes: Each data type has a distinct color:
- 🟦 String
- 🟧 Number
- 🟪 Boolean
- ⬜ Null
- 🟩 Object
- 🟨 Array
- Edge Connections: Clear lines showing parent-child relationships.
- Type Badges: Each node displays its type for quick identification.
- Value Preview: Primitive values are shown directly in the node.
⚙️ Controls
- Fit View: Reset the viewport to show all nodes.
- Zoom In/Out: Precise zoom controls.
- Background Grid: Toggle grid lines for alignment reference.
- Layout Direction: Automatic top-down hierarchical layout.
📤 Export
- SVG Export: Download the entire diagram as a scalable vector graphic.
- PNG Export: Export as a raster image for presentations.
🛠️ How to Use
- Open the Flow Diagram Tool.
- Paste your JSON into the editor or upload a file.
- Explore nodes by clicking to expand/collapse.
- Share your diagram using the Share (🔗) button.
- Export the result as SVG or PNG.
🛠️ Use Cases
- Debugging complex API responses.
- Presenting data structures to non-technical stakeholders.
- Onboarding developers to new internal data models.
- Documenting database schemas and their relationships.
- Exploring unknown third-party API response formats.
💡 Performance Tips
- For very large JSON (10,000+ nodes), the diagram may take a moment to render.
- Use the search feature to navigate directly to the node you need.
- Collapse top-level branches you don't need to focus on.
🚀 Try it now
Visualize your data in the Flow Diagram Tool.