JSON to Mermaid
Visualize JSON structures as 10 different diagram types using Mermaid.js — flowcharts, mind maps, ER diagrams, Gantt charts, and more.
Last updated:
The JSON to Mermaid tool turns abstract data into beautiful, human-readable diagrams. It's perfect for documenting API structures, state machines, project timelines, or organizational charts stored in JSON.
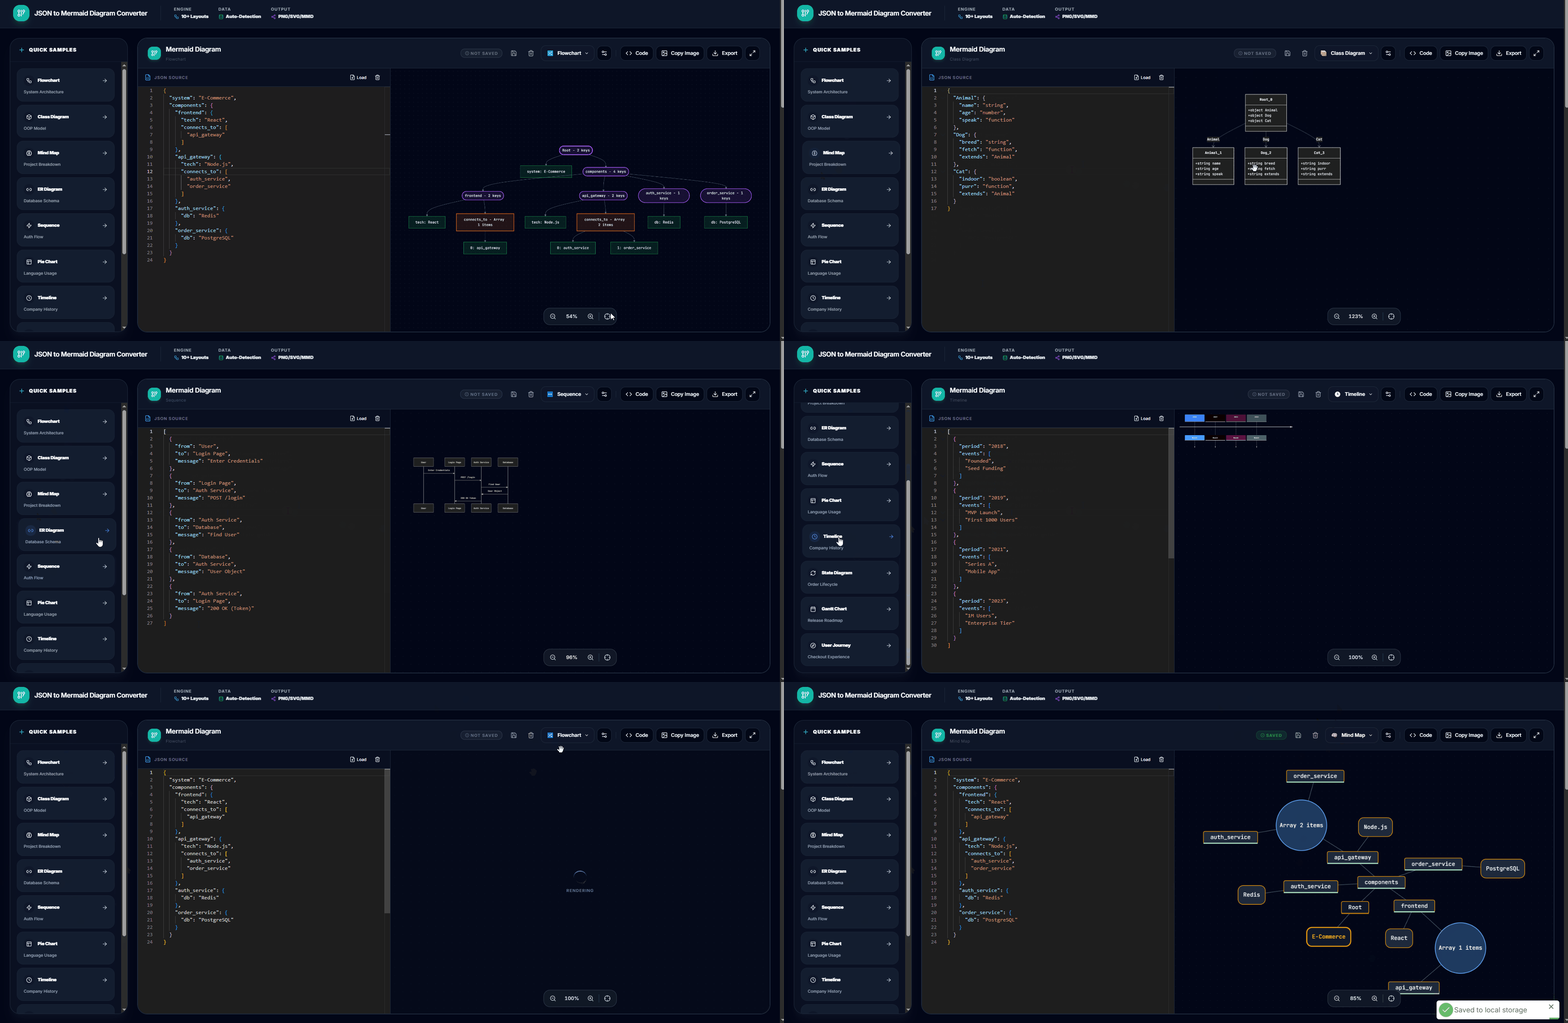
📊 Supported Diagram Types (10)
| Diagram | Best For |
|---|---|
| Flowchart | Hierarchical structure with nodes and edges |
| Class Diagram | Object properties as class diagrams |
| Mind Map | Radial tree layout for JSON hierarchies |
| ER Diagram | Entity-relationship for nested objects |
| Sequence Diagram | Interaction between objects over time |
| Pie Chart | Numerical distribution of data |
| Timeline | Chronological events and dates |
| State Diagram | States and transitions in a process |
| Gantt Chart | Project schedules and dependencies |
| User Journey | Steps, scores, and user experiences |
⚙️ Configuration Options
- Direction: Top-Down, Left-Right, Bottom-Up, Right-Left.
- Curve Style: Basis (rounded), Linear, Step.
- Max Depth: Control how deep into nested structures the diagram goes.
- Max Items: Limit the number of items rendered for performance.
- Date Format: Configure date formatting for Gantt charts (YYYY-MM-DD, DD/MM/YYYY, MM/DD/YYYY).
✨ Features
- Live Preview: The diagram updates instantly as you edit the JSON or change settings.
- Stateless Sharing: Generate compressed links to share your exact JSON and diagram configuration with others.
- SVG Export: Download your diagrams as high-quality vector images.
- PNG Export: Export as raster images for presentations and documentation.
- Fullscreen Mode: Work in a distraction-free view for complex diagrams.
- Zoom & Pan: Navigate large diagrams with smooth controls.
- Dark/Light Themes: Diagrams adapt to your preferred color scheme.
- Code Preview: See and copy the raw Mermaid syntax for embedding in GitHub, Notion, or Confluence.
🛠️ How to Use
- Open the Mermaid Visualizer.
- Paste your JSON into the editor (or upload a file).
- Select the diagram type from the top selector.
- Adjust configuration settings (direction, depth, items).
- Preview the result in real-time.
- Share your work using the Share (🔗) button.
- Export as SVG, PNG, or copy the Mermaid code.
🚀 Try it now
Open the Mermaid Visualizer and paste an object to see it come to life.